
MACD
Two averages that reveal momentum shifts

Read
The scariest-sounding indicator on the island hides the simplest idea: how far is a fast average pulling away from a slow one?
Say it out loud: Moving Average Convergence Divergence. It sounds like a spaceship control panel. It is not. Strip away the intimidating name and MACD is doing one tiny, friendly thing — watching the *gap* between two moving averages.

You already met moving averages last lesson. MACD just takes a fast one and a slow one and asks: how far apart are they right now? When the gap widens, momentum is building. When it shrinks, momentum is fading. That is the whole heartbeat of it.
Three parts on the screen
Open the MACD panel and you will see three things working as a team. Do not let the clutter fool you — each one is simple.
MACD line — the gap itself, the distance between the fast and slow averages. Signal line — a smoothed, slightly-delayed version of the MACD line, used as a trigger. Histogram — bars that measure the *space between* those two lines, so you can see momentum expand and contract at a glance.
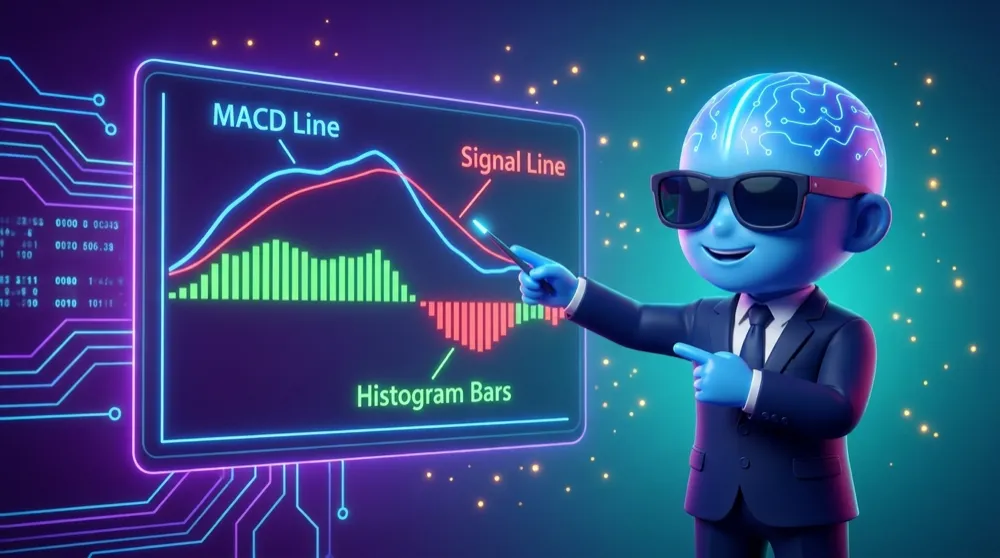
The histogram is not a mystery third indicator — it is simply the distance between the MACD line and the signal line, drawn as bars. Tall bars, lines far apart. Tiny bars, lines converging.
The headline event: the crossover
The moment everyone watches for is when the MACD line crosses its signal line. Cross *above* and it hints upward momentum is warming up — bullish. Cross *below* and it hints momentum is cooling off — bearish. At that exact instant, the histogram flips from one side of zero to the other.

MACD over signal, momentum warming up. MACD under signal, momentum cooling down. The histogram just shows you how much heat is in the move.
A crossover is a *clue*, not a command. The best traders wait for price and trend to agree with the signal before they act. One indicator flipping is a suggestion, not a green light.
The same old catch
Remember why moving averages *lag*? MACD is built entirely from them — so it inherits the exact same delay. It is stitched together from past prices, which means it can only ever trail the live market.
That is not a flaw, it is a job description. MACD confirms a momentum shift *after* it starts. It will never hand you the top or bottom in advance, and any tool that claims to should make you suspicious.
Like every average-based tool, MACD is a step behind reality. Read it as a momentum radar that confirms what is already underway — never as a machine that predicts the future.
You can now read all three parts of the MACD and its all-important crossover. Just one tool left in Chart Cove — the fuel behind every real move: volume. ⛽