Fibonacci retracement
The pullback levels traders watch

Read
After a strong move, price almost never runs in a clean line. It surges, breathes, then often continues. Fibonacci gives you a map of where those breathers tend to stop.
Orange Put here. 📐 A rally is a staircase, not an elevator. Price pushes, pulls back to catch its breath, pushes again. The useful question is not *whether* it will pull back — it will — but how deep the breather usually goes before the trend resumes. That is what this tool answers.
The ratios
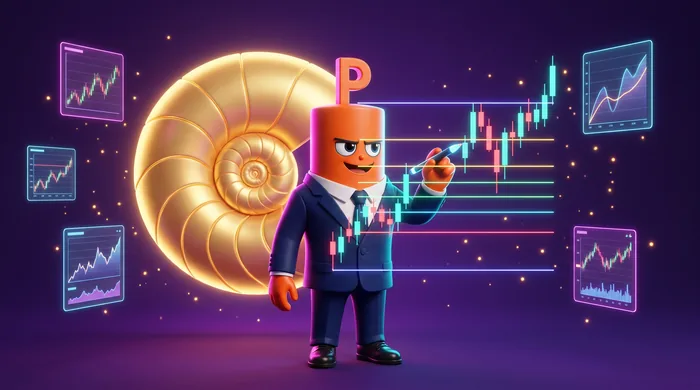
Drag the tool from the swing low to the swing high of a move (reverse it in a downtrend: high to low) and it paints horizontal lines at fixed percentages of that range. Those lines are the pullback levels traders watch.
23.6% — a shallow dip; strong trends barely pause here. 38.2% — a common, healthy pullback. 50% — not a true Fibonacci number at all, but watched by everyone, which is its own reason to care. 61.8% — the "golden ratio", and about as deep as a normal pullback goes before the trend is in question.
Note the direction rule, because getting it backwards produces confident nonsense: low to high in an uptrend, high to low in a downtrend. The levels always land in between.

A zone, not a laser line
The most common mistake is treating 61.8% as a precise price where the market must turn on a dime. It will not. Real reversals happen in a band around the level, and a few pips through it means nothing.
Fibonacci is far more reliable when a level lines up with something else — a prior support or resistance shelf, a round number, a moving average sitting in the same area. That overlap is called confluence, and it is where the tool earns its keep.
Think fuzzy zone, not sniper dot. One level is a suggestion; two levels in the same place is a setup.
Treat the levels as entry ZONES in the direction of the existing trend — not as reversal signals against it. Fibonacci tells you where to look for the trend to resume, not where to fight it.

Extensions are your targets
Once price resumes the trend and clears the old high, the same tool projects forward. Fibonacci extensions at 127.2% and 161.8% act as natural profit targets — places to take something off the table rather than guess or hope.
That gives you both ends of the trade from one drawing: retracements suggest where to get in, extensions suggest where to get out.
Nobody needs to believe in golden ratios for these levels to matter. Enough traders are watching the same lines and placing orders around them that the levels become partly self-fulfilling. That is also why they fail cleanly when the trend is genuinely over — belief is not support.
Draw it on the last strong move on your chart. If a level sits on top of an old shelf, you have found something worth watching. 🎯