
Candlestick patterns
What the shape of a candle is telling you

Read
Every candle is a tiny battle report. Its body and wicks quietly tell you who was winning — if you know how to read the shape.
Hey, green Call here. 👋 Let me let you in on a secret: every single candle on your chart is a battle report. For that slice of time, buyers and sellers grabbed the price and yanked it back and forth. When the smoke clears, the candle's *shape* tells you who won and by how much.

A long body means one side dominated the whole slice. Long wicks mean the other side fought back hard before the bell. Read those two clues and a candle stops being a shape — it becomes a sentence.
Three candles worth memorising
Good news: you do not need a textbook of fifty patterns. A handful carry most of the meaning. Here are the three I want you to know cold.
Doji — the open and close land at almost the same spot, leaving a tiny body. A standoff. Neither side could close the slice ahead, so it flags *indecision*. Hammer — a small body up top with a long lower wick. Sellers shoved price down, but buyers slammed it right back up. Shooting star — a small body down low with a long upper wick. Buyers spiked price up, then sellers crushed it back down.
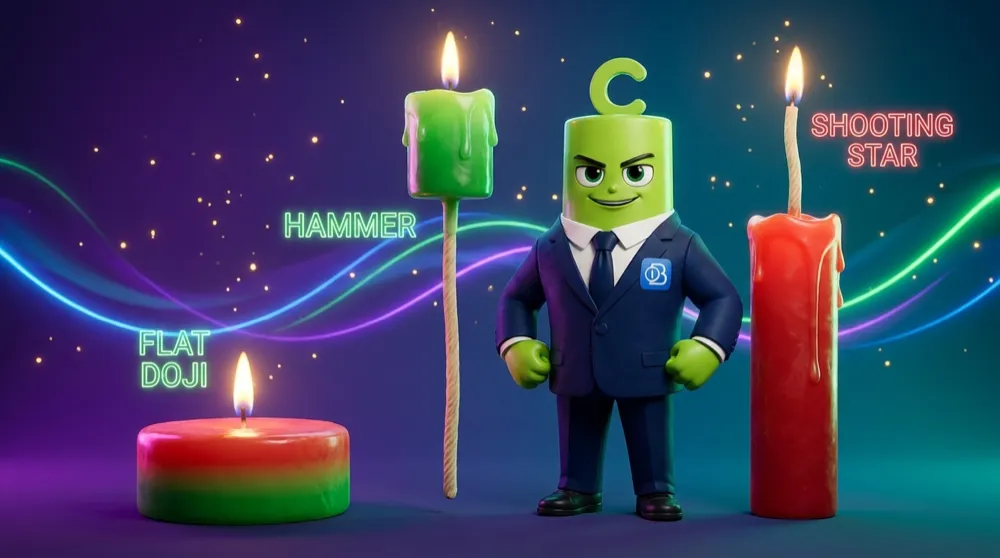
Doji = a standoff. Hammer = buyers stepped up and defended a low. Shooting star = sellers slapped a rally down. The long wick always points to where the *losing* side got rejected.
A long lower wick is proof price *travelled* down there and got rejected. Buyers reclaimed the ground before the close. The wick maps the ground a move tried to take and lost.
A pattern is only as loud as its location
This is where beginners go wrong, so lean in. A candle pattern on its own is a *whisper*, not a promise. What turns a whisper into a shout is where it appears.
A hammer sitting right on a support floor, after a long slide down? That is loud — buyers are defending a level everyone is watching. The exact same hammer floating in the middle of nowhere? Just noise. Same shape, completely different meaning.

A hammer at support is a shout. The same hammer in no-man's-land is just a candle. Location is what gives a pattern its voice.
Before you trust any candle pattern, ask one question: where did this appear? At a key level, after a real move? It matters. Floating in the middle of a range? Let it go.
Now you can read a candle's body language *and* weigh it against the level it lands on. Next up in the Cove, we stop reading single candles and start smoothing the whole noisy crowd into one clean line — moving averages. 🔨