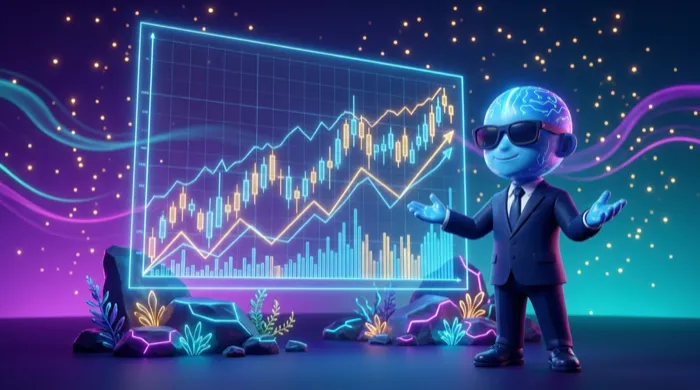
A chart is just a story of price over time
Every chart answers two questions at once: what was the price, and when? Time runs left to right along the bottom, price runs bottom to top along the side. Old news sits on the left, the freshest tick sits on the far right edge.